
Many a woodworker, no matter the season, can identify every tree in their yard and neighborhood. You recognize and value trees for the wood they provide for your shop and also their role in improving our environment. Part of the craft of woodworking is that many of will also be citizen scientists, both in your knowledge of, and protection of trees. Street (or public) tree maps are another resource to learn more about trees, enhance your enjoyment of your community and can be another sort of travel map.
Although most of the following maps are for large cities, there are many smaller cities that have tree maps and inventories and there are many more cities looking for volunteers to help map trees. Every map is a document to help educate the public about the benefit of trees in the community, how trees are cared for, why and how more trees will be planted and how the public will help.
How do these maps work?
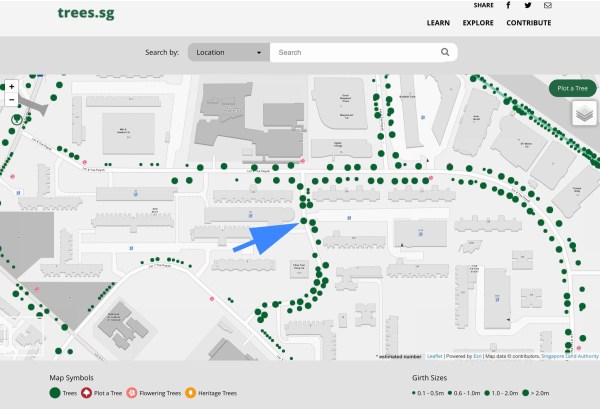
This is the tree map for Singapore. After zooming in I selected a tree (blue arrow) to find out what it is.
This is the information about the tree I selected. It is a Jemerlang Laut known by several other names including the Yellow Flame. As you can see it is native to Singapore and is critically endangered. The pruning schedule is cut off, however, it is due for a “haircut” in the second quarter of 2020.

The sidebar on New York City’s map provides statistics, recent tree activity (pruning, litter clean-up, damage) and the ecological benefits of trees (water savings, energy savings). There are options to report problems and also plans for plantings and removals. This map also let’s you search for a specific location. New York City’s map can be found here.
One of the delights of opening a tree map is the color schemes you will encounter and Melbourne doesn’t disappoint. Part of Melbourne’s planting scheme involves identifying where the most vulnerable residents are, the tree canopy density is low and which streets are hottest in summer. Melbourne’s Urban Forest map can be found here.
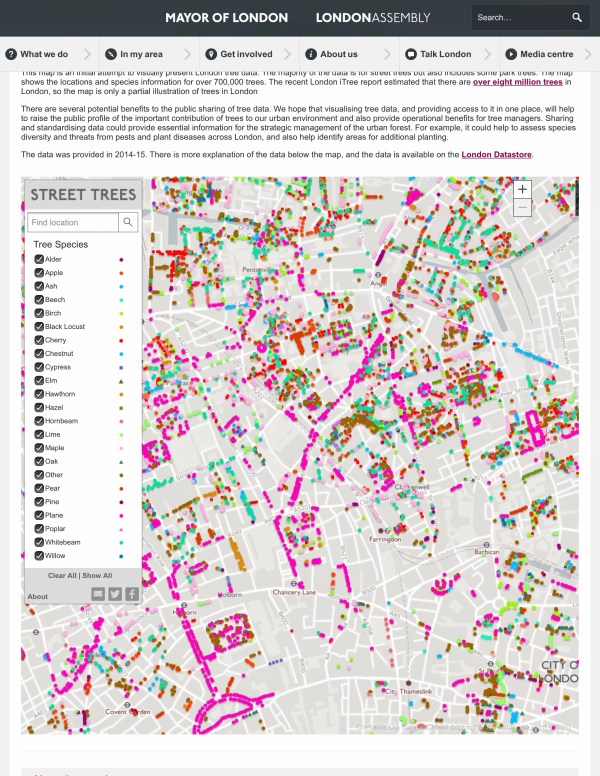
What is all that pink on London’s map? Plane trees. London Plane trees. What is New York City’s most common tree? London Plane tree. The current map shows 700,000 trees, however, it is estimated there are over eight million trees in London. That is a lot of mapping still to do. You can find London’s map here.
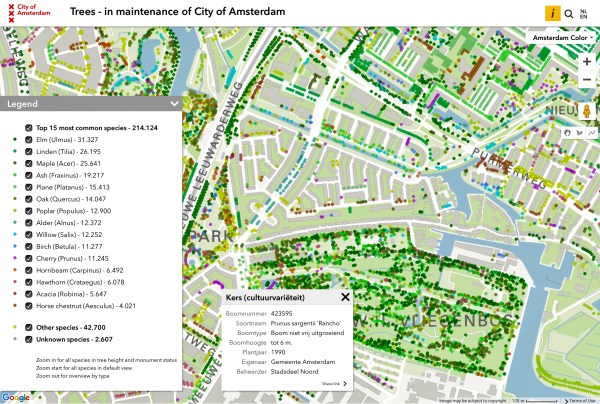
As you zoom in and the color dots start getting a bit further apart it is easier to pinpoint an individual tree. The information boxes for each tree will vary. Amsterdam’s map provides a full plate of information including when the tree was planted. The planting date combined with the expected life span of tree species in the urban environment is used to plan for future replacement. For the ecologist it is a data point of use in studying a tree species in the complicated urban environment. Amsterdam’s tree map is here.
Montreal’s trees are plotted over a satellite image of the city (you can see your own street and house). In this screen shot the color legend really highlights how the same tree species was planted on long stretches of a street (this is not unique to Montreal). As the climates in our cities change what will be the effect on the lack of tree diversity on a particular street? This is another use for tree maps. You can find Montreal’s map here.
Some Special Features and Options
The next few examples have options that might not be available on all maps.
Vancouver allows the selection of four parameters (either individually or in combination) needed for studying trees: age, diameter, height and species. Wowee! In the above screen shot I selected one parameter: trees between 50 ft-100 ft in height.
In this second screen shot I selected trees with a diameter between 50 and 150 inches. Vancouver’s map can be found here.

This is a map of the flowering trees of Washington D.C. (provided by Casey Trees a non-profit group involved in restoring and protecting the tree canopy of the city). Peak cherry blossom time happens to right now (March 21-24). The map is for the 2019 season but should still be good. The flowering tree map can be found here.
I did not search every tree on every map so perhaps not all cities record stumps. St. Louis (birthplace of the founder of the blog) recorded tree stumps. I commend the thoroughness of the fine mappers of the Show Me State. The St. Louis map can be found here.
“On, Wisconsin!”
Wisconsin has a state tree map. When the map is opened find the community list, make your selection and it will take you there. The tree species list scrolls up and down to help the viewer identify the trees. The screen shows Green Bay. The Wisconsin map can be found here.
By the way, Wisconsin is the leading manufacturer of paper products in the United States. Paper products includes the very precious commodity we call toilet paper. Green Bay is the toilet paper capital of the world (should that be capitalized?). If a state can map all the trees in its communities I am confident they are running at full capacity to manufacture and supply all those in need of toilet paper in these very trying times. We will have our toilet paper and we will be OK.
Stuck at Home
Not everyone reading this blog can leave their homes unless it is to find and buy essential items. The luxury of a neighborhood stroll to find and identify your local trees is limited or not possible. Instead, zoom in and take a virtual walk or plan a walk in a city you want to visit in the future. Make a mini-map of your neighborhood or favorite park.
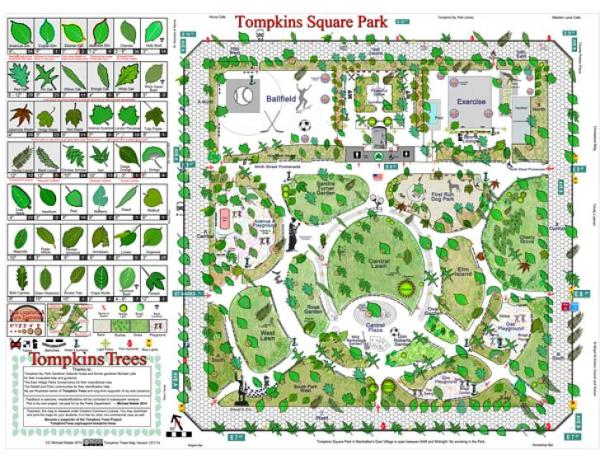
Michael Natale, resident of New York’s East Village, made this map over a period of 4 years. He photographed and gathered information on 550 trees. Your map doesn’t have to be this detailed.
Tree maps will go with me on future travels. In the interim the maps are providing some interesting patterns on paper. So, for now it is by hand and eye and origami.
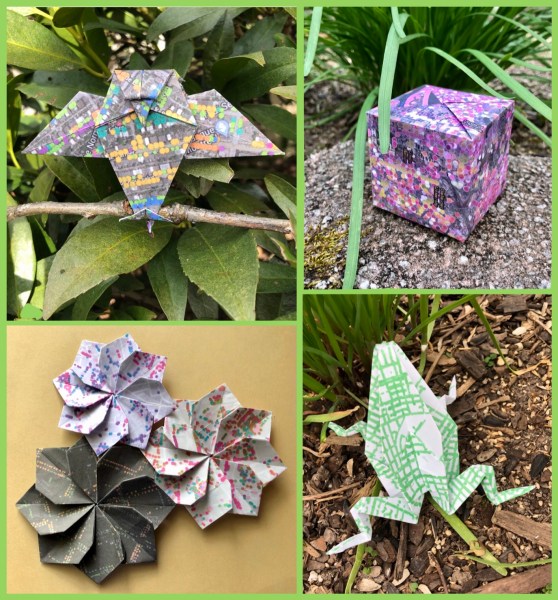
–Suzanne Ellison






Very cool, had no idea. Wish I had this when I went to the English Garden in Munich, thats one of my favorite places to stroll. I’ll have to dig these up for my city and cities I visit for work(once that happens again)
As a cartographer, woodworker, tree hugger, and geographer ( in morning assigned order) this warms my heart. As one who has been involved in high resolution satellite imagery of vegetative cover & foliage, I can assure you that ground truth via our study and musings is essential to accuracy.
Thank you for recognizing paper as an amazing agricultural product. We can thank trees each time we blow our nose or take a wipe!
Thank you for this delightful post. It brought smiles and chuckles
This is amazing! Thank you.
I had no idea. Very cool, thank you!
Thank you. I was just about to blow this post off, and I started reading it. Interesting and thought provoking. Once leaf out comes, and if we can still walk the streets here in Colorado, it would be a great way of spending time. Question: does one have to social distance from trees?
With the reduction of vehicle traffic in the last few weeks there is less pollution trees have had to filter for us. I believe a tree might welcome a friendly pat or hug, but no kissing (insects).
Lovely post, and the origami pieces are wonderful.
Wood workers just outside of D.C. on the Maryland side will also be aware of the Kenwood neighborhood where you can drive through and see some wonderful old cherry trees.
The inventory for Corvallis Oregon can be found here.
https://corvallisor.treekeepersoftware.com/index.cfm#/admin/home
We also have a program where trees that are removed are milled into lumber, turning blocks etc for use by local artisans. IF you are in the area please get in touch.
Jon Pywell
Urban Forester
Corvallis Oregon
541-754-1723
For Frankfurt there is a map as well. Besides a tooltip with info on the tree it also has the marker scaled to size of crown span.
https://geoinfo.frankfurt.de/mapbender/application/baumkataster
Here is the map for Austin:
https://mct.tfs.tamu.edu/app
There are a few other Texas cities that are still completing their maps.
The brief wondering on climate changes effect on urban tree monocultures brings up another thing developers didn’t plan on (Granted, most mid20th century didn’t plan for anything but money): Most nice city neighborhoods and inner suburbs in my area all planted silver maples, red maples, Norway Spruce and Blue Spruce, picked for the spruces’ relatively short mature height and rapid growth. Unfortunately it has 60-70 years now since these neighborhoods were built and trees planted, and now we get fierce windstorms and the occasional tornado. Soft maples rarely live to 100 and rot quickly, often dying around 60-70, dropping heavy limbs at the slightest breeze. The spruces picked out have very shallow root systems. You can see where this is going without having to mention this was all built on drained wetland, so the soil is often very waterlogged. There is an absolute glut of spruce and huge maples dying; every street is lined with wood to take away. Woodturners are overrun with spalted gifts, and when there’s a windstorm, tree services from Canada often drive across the border to help dig the city out from wood and get the lights turned back on.